
 EN
EN


Check out figures and service's evolution
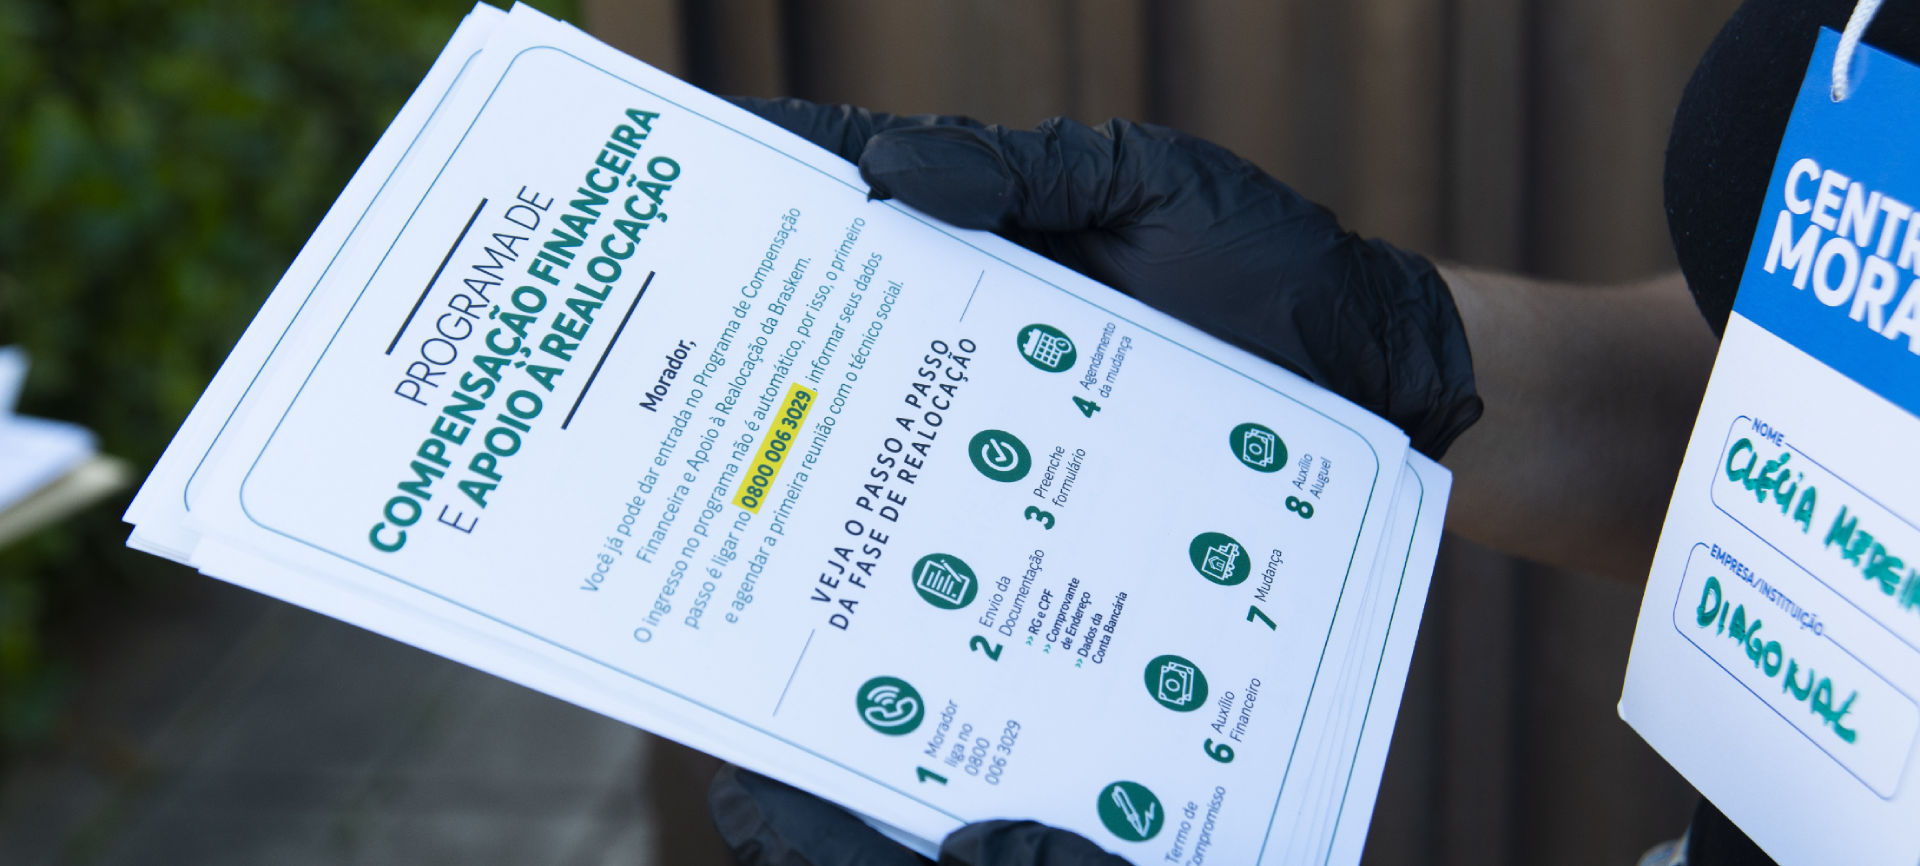
You will find updated data on the Financial Compensation and Relocation Support Program (PCF) on this page. The purpose is to ensure even more transparency and accountability to society on the evolution of service to households, traders, and entrepreneurs in the evicted and monitoring zones in Maceió.
The PCF was created in November 2019 to benefit residents within the protection zone around the salt wells, being later expanded to include residents, traders, and entrepreneurs within the evicted and monitoring zones designated by the Civil Defense, under an agreement signed in January 2020 with the relevant authorities*.
* Federal Prosecution Office (MPF), Public Prosecution Office of the State of Alagoas (MPE), Federal Public Defender's Office (DPU), and Public Defender's Office of the State of Alagoas (DPE)

-
14.5 THOUSAND PROPERTIES identified in the evicted and monitoring zones;
-
14.5 THOUSAND PROPERTIES evicted;
-
19,205 COMPENSATION PROPOSALS submitted;
-
19,128 COMPENSATIONS paid;
-
6,171 COMPENSATION PROPOSALS submitted to traders and entrepreneurs;
-
More than BRL 4.2 BILLION PAID in compensation and financial aid.
- Updated on (05/31/2026)

*The numbers shown in the chart represent the cumulative total for the years
The difference between the number of submitted/accepted proposals is due to the deadlines within which families have to review the amounts offered and/or request reanalysis of the submitted proposal.
Such data is reported monthly by Braskem to the authorities that signed the Agreement term in January 2020.
Click below to see monthly PCF data for residential properties:

June 2025 - Residences
| Eviction map areas | Identified Properties. | Evicted Properties | Pending Eviction Properties | Accepted Proposals |
|---|---|---|---|---|
| Protection | 514 | 514 | 0 | 650 |
| Zone A | 1,633 | 1,633 | 0 | 1,965 |
| Zone B | 77 | 77 | 0 | 89 |
| Zone C | 154 | 154 | 0 | 188 |
| Zone D | 2,818 | 2,818 | 0 | 3,428 |
| Zone E | 2,627 | 2,627 | 0 | 3,524 |
| Zone F | 61 | 61 | 0 | 89 |
| Zone G | 2,380 | 2,380 | 0 | 3,211 |
| Zone H | 1,397 | 1,397 | 0 | 1,978 |
| Total area 00 | 11,661 | 11,661 | 0 | 15,122 |
| Area 01 | 2,888 | 2,872 | 16 | 3,983 |
| Overall Total | 14,549 | 14,533 | 16 | 19,105 |
Data from Area 00 considers evictions that occurred after a court order by the Civil Defense of Maceió until December 2, 2023. Area 00 is totally evicted. 1. It does not consider large equipment, Braskem properties, and other cases that will be treated separately 2. Properties that entered PCF through the Technical Board and overlap the area set in the new Agreement are accounted for by the geographical criterion
July 2025 - Residences
| Eviction map areas | Identified Properties. | Evicted Properties | Pending Eviction Properties | Accepted Proposals |
|---|---|---|---|---|
| Protection | 514 | 514 | 0 | 650 |
| Zone A | 1,633 | 1,633 | 0 | 1,965 |
| Zone B | 77 | 77 | 0 | 89 |
| Zone C | 154 | 154 | 0 | 188 |
| Zone D | 2,818 | 2,818 | 0 | 3,428 |
| Zone E | 2,627 | 2,627 | 0 | 3,525 |
| Zone F | 61 | 61 | 0 | 89 |
| Zone G | 2,380 | 2,380 | 0 | 3,211 |
| Zone H | 1,397 | 1,397 | 0 | 1,979 |
| Total area 00 | 11,661 | 11,661 | 0 | 15,124 |
| Area 01 | 2,888 | 2,872 | 16 | 3,987 |
| Overall Total | 14,549 | 14,533 | 16 | 19,111 |
Data from Area 00 considers evictions that occurred after a court order by the Civil Defense of Maceió until December 2, 2023. Area 00 is totally evicted. 1. It does not consider large equipment, Braskem properties, and other cases that will be treated separately 2. Properties that entered PCF through the Technical Board and overlap the area set in the new Agreement are accounted for by the geographical criterion
August 2025 - Residences
| Eviction map areas | Identified Properties. | Evicted Properties | Pending Eviction Properties | Accepted Proposals |
|---|---|---|---|---|
| Protection | 514 | 514 | 0 | 650 |
| Zone A | 1,633 | 1,633 | 0 | 1,966 |
| Zone B | 77 | 77 | 0 | 89 |
| Zone C | 154 | 154 | 0 | 188 |
| Zone D | 2,818 | 2,818 | 0 | 3,428 |
| Zone E | 2,627 | 2,627 | 0 | 3,525 |
| Zone F | 61 | 61 | 0 | 89 |
| Zone G | 2,380 | 2,380 | 0 | 3,211 |
| Zone H | 1,397 | 1,397 | 0 | 1,979 |
| Total area 00 | 11,661 | 11,661 | 0 | 15,125 |
| Area 01 | 2,888 | 2,874 | 14 | 3,990 |
| Overall Total | 14,549 | 14,535 | 14 | 19,115 |
Data from Area 00 considers evictions that occurred after a court order by the Civil Defense of Maceió until December 2, 2023. Area 00 is totally evicted. 1. It does not consider large equipment, Braskem properties, and other cases that will be treated separately 2. Properties that entered PCF through the Technical Board and overlap the area set in the new Agreement are accounted for by the geographical criterion
September 2025 - Residences
| Eviction map areas | Identified Properties. | Evicted Properties | Pending Eviction Properties | Accepted Proposals |
|---|---|---|---|---|
| Protection | 514 | 514 | 0 | 650 |
| Zone A | 1,633 | 1,633 | 0 | 1,966 |
| Zone B | 77 | 77 | 0 | 89 |
| Zone C | 154 | 154 | 0 | 188 |
| Zone D | 2,818 | 2,818 | 0 | 3,429 |
| Zone E | 2,627 | 2,627 | 0 | 3,526 |
| Zone F | 61 | 61 | 0 | 89 |
| Zone G | 2,380 | 2,380 | 0 | 3,211 |
| Zone H | 1,397 | 1,397 | 0 | 1,979 |
| Total area 00 | 11,661 | 11,661 | 0 | 15,127 |
| Area 01 | 2,888 | 2,874 | 14 | 3,991 |
| Overall Total | 14,549 | 14,535 | 15 | 19,118 |
Data from Area 00 considers evictions that occurred after a court order by the Civil Defense of Maceió until December 2, 2023. Area 00 is totally evicted. 1. It does not consider large equipment, Braskem properties, and other cases that will be treated separately 2. Properties that entered PCF through the Technical Board and overlap the area set in the new Agreement are accounted for by the geographical criterion
October 2025 - Residences
| Eviction map areas | Identified Properties. | Evicted Properties | Pending Eviction Properties | Accepted Proposals |
|---|---|---|---|---|
| Protection | 514 | 514 | 0 | 650 |
| Zone A | 1,633 | 1,633 | 0 | 1,966 |
| Zone B | 77 | 77 | 0 | 89 |
| Zone C | 154 | 154 | 0 | 188 |
| Zone D | 2,818 | 2,818 | 0 | 3,429 |
| Zone E | 2,627 | 2,627 | 0 | 3,527 |
| Zone F | 61 | 61 | 0 | 89 |
| Zone G | 2,380 | 2,380 | 0 | 3,213 |
| Zone H | 1,397 | 1,397 | 0 | 1,979 |
| Total area 00 | 11,661 | 11,661 | 0 | 15,130 |
| Area 01 | 2,888 | 2,875 | 13 | 3,992 |
| Overall Total | 14,549 | 14,536 | 13 | 19,122 |
Data from Area 00 considers evictions that occurred after a court order by the Civil Defense of Maceió until December 2, 2023. Area 00 is totally evicted. 1. It does not consider large equipment, Braskem properties, and other cases that will be treated separately 2. Properties that entered PCF through the Technical Board and overlap the area set in the new Agreement are accounted for by the geographical criterion
November 2025 - Residences
| Eviction map areas | Identified Properties. | Evicted Properties | Pending Eviction Properties | Accepted Proposals |
|---|---|---|---|---|
| Protection | 514 | 514 | 0 | 650 |
| Zone A | 1,633 | 1,633 | 0 | 1,966 |
| Zone B | 77 | 77 | 0 | 89 |
| Zone C | 154 | 154 | 0 | 188 |
| Zone D | 2,818 | 2,818 | 0 | 3,429 |
| Zone E | 2,627 | 2,627 | 0 | 3,530 |
| Zone F | 61 | 61 | 0 | 89 |
| Zone G | 2,380 | 2,380 | 0 | 3,213 |
| Zone H | 1,397 | 1,397 | 0 | 1,980 |
| Total area 00 | 11,661 | 11,661 | 0 | 15,134 |
| Area 01 | 2,888 | 2,875 | 13 | 3,993 |
| Overall Total | 14,549 | 14,536 | 13 | 19,127 |
Data from Area 00 considers evictions that occurred after a court order by the Civil Defense of Maceió until December 2, 2023. Area 00 is totally evicted. 1. It does not consider large equipment, Braskem properties, and other cases that will be treated separately 2. Properties that entered PCF through the Technical Board and overlap the area set in the new Agreement are accounted for by the geographical criterion
December 2025 - Residences
| Eviction map areas | Identified Properties. | Evicted Properties | Pending Eviction Properties | Accepted Proposals |
|---|---|---|---|---|
| Protection | 514 | 514 | 0 | 651 |
| Zone A | 1,633 | 1,633 | 0 | 1,966 |
| Zone B | 77 | 77 | 0 | 89 |
| Zone C | 154 | 154 | 0 | 188 |
| Zone D | 2,818 | 2,818 | 0 | 3,429 |
| Zone E | 2,627 | 2,627 | 0 | 3,532 |
| Zone F | 61 | 61 | 0 | 89 |
| Zone G | 2,380 | 2,380 | 0 | 3,213 |
| Zone H | 1,397 | 1,397 | 0 | 1,980 |
| Total area 00 | 11,661 | 11,661 | 0 | 15,135 |
| Area 01 | 2,889 | 2,876 | 13 | 3,994 |
| Overall Total | 14,550 | 14,537 | 13 | 19,131 |
Data from Area 00 considers evictions that occurred after a court order by the Civil Defense of Maceió until December 2, 2023. Area 00 is totally evicted. 1. It does not consider large equipment, Braskem properties, and other cases that will be treated separately 2. Properties that entered PCF through the Technical Board and overlap the area set in the new Agreement are accounted for by the geographical criterion
January 2026 - Residences
| Eviction map areas | Identified Properties. | Evicted Properties | Pending Eviction Properties | Accepted Proposals |
|---|---|---|---|---|
| Protection | 514 | 514 | 0 | 651 |
| Zone A | 1,633 | 1,633 | 0 | 1,966 |
| Zone B | 77 | 77 | 0 | 89 |
| Zone C | 154 | 154 | 0 | 188 |
| Zone D | 2,818 | 2,818 | 0 | 3,429 |
| Zone E | 2,627 | 2,627 | 0 | 3,532 |
| Zone F | 61 | 61 | 0 | 89 |
| Zone G | 2,380 | 2,380 | 0 | 3,213 |
| Zone H | 1,397 | 1,397 | 0 | 1,980 |
| Total area 00 | 11,661 | 11,661 | 0 | 15,135 |
| Area 01 | 2,889 | 2,878 | 13 | 3,996 |
| Overall Total | 14,550 | 14,539 | 11 | 19,133 |
Data from Area 00 considers evictions that occurred after a court order by the Civil Defense of Maceió until December 2, 2023. Area 00 is totally evicted. 1. It does not consider large equipment, Braskem properties, and other cases that will be treated separately 2. Properties that entered PCF through the Technical Board and overlap the area set in the new Agreement are accounted for by the geographical criterion
FEBRUARY 2026 - Residences
| Eviction map areas | Identified Properties. | Evicted Properties | Pending Eviction Properties | Accepted Proposals |
|---|---|---|---|---|
| Protection | 514 | 514 | 0 | 651 |
| Zone A | 1,633 | 1,633 | 0 | 1,966 |
| Zone B | 77 | 77 | 0 | 89 |
| Zone C | 154 | 154 | 0 | 188 |
| Zone D | 2,818 | 2,818 | 0 | 3,429 |
| Zone E | 2,627 | 2,627 | 0 | 3,532 |
| Zone F | 61 | 61 | 0 | 89 |
| Zone G | 2,380 | 2,380 | 0 | 3,213 |
| Zone H | 1,397 | 1,397 | 0 | 1,980 |
| Total area 00 | 11,661 | 11,661 | 0 | 15,135 |
| Area 01 | 2,889 | 2,878 | 11 | 3,998 |
| Overall Total | 14,550 | 14,539 | 11 | 19,135 |
Data from Area 00 considers evictions that occurred after a court order by the Civil Defense of Maceió until December 2, 2023. Area 00, defined by Civil Defense in 2020, is 100% unoccupied. 1. It does not consider large equipment, Braskem properties, and other cases that will be treated separately 2. Properties that entered PCF through the Technical Board and overlap the area set in the new Agreement are accounted for by the geographical criterion
MARCH 2026 - Residences
| Eviction map areas | Identified Properties. | Evicted Properties | Pending Eviction Properties | Accepted Proposals |
|---|---|---|---|---|
| Protection | 514 | 514 | 0 | 651 |
| Zone A | 1,633 | 1,633 | 0 | 1,966 |
| Zone B | 77 | 77 | 0 | 89 |
| Zone C | 154 | 154 | 0 | 188 |
| Zone D | 2,818 | 2,818 | 0 | 3,430 |
| Zone E | 2,627 | 2,627 | 0 | 3,532 |
| Zone F | 61 | 61 | 0 | 89 |
| Zone G | 2,380 | 2,380 | 0 | 3,213 |
| Zone H | 1,397 | 1,397 | 0 | 1,980 |
| Total area 00 | 11,661 | 11,661 | 0 | 15,138 |
| Area 01 | 2,889 | 2,880 | 09 | 3,998 |
| Overall Total | 14,550 | 14,541 | 09 | 19,136 |
Data from Area 00 considers evictions that occurred after a court order by the Civil Defense of Maceió until December 2, 2023. Area 00, defined by Civil Defense in 2020, is 100% unoccupied. 1. It does not consider large equipment, Braskem properties, and other cases that will be treated separately 2. Properties that entered PCF through the Technical Board and overlap the area set in the new Agreement are accounted for by the geographical criterion
APRIL 2026 - Residences
| Eviction map areas | Identified Properties. | Evicted Properties | Pending Eviction Properties | Accepted Proposals |
|---|---|---|---|---|
| Protection | 514 | 514 | 0 | 651 |
| Zone A | 1,633 | 1,633 | 0 | 1,966 |
| Zone B | 77 | 77 | 0 | 89 |
| Zone C | 154 | 154 | 0 | 188 |
| Zone D | 2,818 | 2,818 | 0 | 3,430 |
| Zone E | 2,627 | 2,627 | 0 | 3,532 |
| Zone F | 61 | 61 | 0 | 89 |
| Zone G | 2,380 | 2,380 | 0 | 3,213 |
| Zone H | 1,397 | 1,397 | 0 | 1,980 |
| Total area 00 | 11,661 | 11,661 | 0 | 15,138 |
| Area 01 | 2,889 | 2,881 | 08 | 3,998 |
| Overall Total | 14,550 | 14,542 | 08 | 19,136 |
Data from Area 00 considers evictions that occurred after a court order by the Civil Defense of Maceió until December 2, 2023. Area 00, defined by Civil Defense in 2020, is 100% unoccupied. 1. It does not consider large equipment, Braskem properties, and other cases that will be treated separately 2. Properties that entered PCF through the Technical Board and overlap the area set in the new Agreement are accounted for by the geographical criterion
MAY 2026 - Residences
| Eviction map areas | Identified Properties. | Evicted Properties | Pending Eviction Properties | Accepted Proposals |
|---|---|---|---|---|
| Protection | 514 | 514 | 0 | 651 |
| Zone A | 1,633 | 1,633 | 0 | 1,967 |
| Zone B | 77 | 77 | 0 | 89 |
| Zone C | 154 | 154 | 0 | 188 |
| Zone D | 2,818 | 2,818 | 0 | 3,430 |
| Zone E | 2,627 | 2,627 | 0 | 3,532 |
| Zone F | 61 | 61 | 0 | 89 |
| Zone G | 2,380 | 2,380 | 0 | 3,213 |
| Zone H | 1,397 | 1,397 | 0 | 1,980 |
| Total area 00 | 11,661 | 11,661 | 0 | 15,138 |
| Area 01 | 2,889 | 2,881 | 08 | 4,001 |
| Overall Total | 14,550 | 14,542 | 08 | 19,140 |
Data from Area 00 considers evictions that occurred after a court order by the Civil Defense of Maceió until December 2, 2023. Area 00, defined by Civil Defense in 2020, is 100% unoccupied. 1. It does not consider large equipment, Braskem properties, and other cases that will be treated separately 2. Properties that entered PCF through the Technical Board and overlap the area set in the new Agreement are accounted for by the geographical criterion
Click below to see monthly PCF data for commercial and mixed properties:

June 2025 - Traders
| Relocation | Compensation | ||||
|---|---|---|---|---|---|
| Eviction map areas | Properties | Properties relocated or under move | Orders that started the compensation flow | Submitted Proposals | Compensations Paid |
| Protection | 129 | 129 (100%) | 185 | 185 (100%) | 185 |
| Zone A | 310 | 310 (100%) | 345 | 345 (100%) | 344 |
| Zone B | 8 | 8 (100%) | 9 | 9 (100%) | 9 |
| Zone C | 50 | 50 (100%) | 64 | 64 (100%) | 62 |
| Zone D | 661 | 661 (100%) | 875 | 874 (99%) | 863 |
| Zone E | 782 | 782 (100%) | 1,044 | 1,044 (100%) | 1,033 |
| Zone F | 25 | 25 (100%) | 36 | 36 (100%) | 35 |
| Zone G | 1,007 | 1,007 (100%) | 1,377 | 1,376 (100%) | 1,366 |
| Zone H | 504 | 504 (100%) | 723 | 723 (100%) | 717 |
| Area 01 | 1,038 | 1,034 (99%) | 1,511 | 1,511 (100%) | 1,499 |
| Overall Total | 4,514 | 4,510 (99%) | 6,169 | 6,167 (99%) | 6,113 |
1. Total stamps classified as an entrepreneur over the meeting to enter the compensation flow. 2. The number of claims filed in the Protected Area and Zones A, B, C, D, E, and F is greater than the respective number of relocated properties, since some properties have more than one claim (typically owner + lessee). 3. The number of properties identified considers information obtained in the field, in addition to details of the relocation and compensation claims. These figures may change as analyses progress and the documentation is submitted.
July 2025 - Traders
| Relocation | Compensation | ||||
|---|---|---|---|---|---|
| Eviction map areas | Properties | Properties relocated or under move | Orders that started the compensation flow | Submitted Proposals | Compensations Paid |
| Protection | 129 | 129 (100%) | 185 | 185 (100%) | 185 |
| Zone A | 310 | 310 (100%) | 345 | 345 (100%) | 345 |
| Zone B | 8 | 8 (100%) | 9 | 9 (100%) | 9 |
| Zone C | 50 | 50 (100%) | 64 | 64 (100%) | 63 |
| Zone D | 661 | 661 (100%) | 875 | 874 (99%) | 863 |
| Zone E | 782 | 782 (100%) | 1,044 | 1,044 (100%) | 1,034 |
| Zone F | 25 | 25 (100%) | 36 | 36 (100%) | 35 |
| Zone G | 1,007 | 1,007 (100%) | 1,377 | 1,376 (100%) | 1,369 |
| Zone H | 504 | 504 (100%) | 723 | 723 (100%) | 717 |
| Area 01 | 1,038 | 1,034 (99%) | 1,511 | 1,511 (100%) | 1,502 |
| Overall Total | 4,514 | 4,510 (99%) | 6,168 | 6,167 (99%) | 6,122 |
1. Total stamps classified as an entrepreneur over the meeting to enter the compensation flow. 2. The number of claims filed in the Protected Area and Zones A, B, C, D, E, and F is greater than the respective number of relocated properties, since some properties have more than one claim (typically owner + lessee). 3. The number of properties identified considers information obtained in the field, in addition to details of the relocation and compensation claims. These figures may change as analyses progress and the documentation is submitted.
August 2025 - Traders
| Relocation | Compensation | ||||
|---|---|---|---|---|---|
| Eviction map areas | Properties | Properties relocated or under move | Orders that started the compensation flow | Submitted Proposals | Compensations Paid |
| Protection | 129 | 129 (100%) | 185 | 185 (100%) | 185 |
| Zone A | 310 | 310 (100%) | 345 | 345 (100%) | 345 |
| Zone B | 8 | 8 (100%) | 9 | 9 (100%) | 9 |
| Zone C | 50 | 50 (100%) | 64 | 64 (100%) | 63 |
| Zone D | 661 | 661 (100%) | 875 | 874 (99%) | 863 |
| Zone E | 782 | 782 (100%) | 1,044 | 1,044 (100%) | 1,034 |
| Zone F | 25 | 25 (100%) | 36 | 36 (100%) | 35 |
| Zone G | 1,007 | 1,007 (100%) | 1,376 | 1,376 (100%) | 1,369 |
| Zone H | 504 | 504 (100%) | 723 | 723 (100%) | 718 |
| Area 01 | 1,038 | 1,035 (99%) | 1,511 | 1,511 (100%) | 1,502 |
| Overall Total | 4,514 | 4,511 (99%) | 6,168 | 6,167 (99%) | 6,123 |
1. Total stamps classified as an entrepreneur over the meeting to enter the compensation flow. 2. The number of claims filed in the Protected Area and Zones A, B, C, D, E, and F is greater than the respective number of relocated properties, since some properties have more than one claim (typically owner + lessee). 3. The number of properties identified considers information obtained in the field, in addition to details of the relocation and compensation claims. These figures may change as analyses progress and the documentation is submitted.
September 2025 - Traders
| Relocation | Compensation | ||||
|---|---|---|---|---|---|
| Eviction map areas | Properties | Properties relocated or under move | Orders that started the compensation flow | Submitted Proposals | Compensations Paid |
| Protection | 129 | 129 (100%) | 185 | 185 (100%) | 185 |
| Zone A | 310 | 310 (100%) | 345 | 345 (100%) | 345 |
| Zone B | 8 | 8 (100%) | 9 | 9 (100%) | 9 |
| Zone C | 50 | 50 (100%) | 64 | 64 (100%) | 63 |
| Zone D | 661 | 661 (100%) | 875 | 875 (99%) | 863 |
| Zone E | 782 | 782 (100%) | 1,043 | 1,042 (100%) | 1,035 |
| Zone F | 25 | 25 (100%) | 36 | 36 (100%) | 35 |
| Zone G | 1,007 | 1,007 (100%) | 1,377 | 1,376 (100%) | 1,370 |
| Zone H | 504 | 504 (100%) | 723 | 723 (100%) | 719 |
| Area 01 | 1,038 | 1,035 (99%) | 1,512 | 1,511 (100%) | 1,503 |
| Overall Total | 4,514 | 4,511 (99%) | 6,169 | 6,166 (99%) | 6,127 |
1. Total stamps classified as an entrepreneur over the meeting to enter the compensation flow. 2. The number of claims filed in the Protected Area and Zones A, B, C, D, E, and F is greater than the respective number of relocated properties, since some properties have more than one claim (typically owner + lessee). 3. The number of properties identified considers information obtained in the field, in addition to details of the relocation and compensation claims. These figures may change as analyses progress and the documentation is submitted.
October 2025 - Traders
| Relocation | Compensation | ||||
|---|---|---|---|---|---|
| Eviction map areas | Properties | Properties relocated or under move | Orders that started the compensation flow | Submitted Proposals | Compensations Paid |
| Protection | 129 | 129 (100%) | 185 | 185 (100%) | 185 |
| Zone A | 310 | 310 (100%) | 345 | 345 (100%) | 345 |
| Zone B | 8 | 8 (100%) | 9 | 9 (100%) | 9 |
| Zone C | 50 | 50 (100%) | 64 | 64 (100%) | 64 |
| Zone D | 661 | 661 (100%) | 875 | 875 (100%) | 864 |
| Zone E | 782 | 782 (100%) | 1,043 | 1,042 (100%) | 1,035 |
| Zone F | 25 | 25 (100%) | 36 | 36 (100%) | 35 |
| Zone G | 1,007 | 1,007 (100%) | 1,378 | 1,378 (100%) | 1,370 |
| Zone H | 504 | 504 (100%) | 723 | 723 (100%) | 719 |
| Area 01 | 1,038 | 1,035 (99%) | 1,514 | 1,511 (99%) | 1,503 |
| Overall Total | 4,514 | 4,511 (99%) | 6,172 | 6,168 (99%) | 6,129 |
1. Total stamps classified as an entrepreneur over the meeting to enter the compensation flow. 2. The number of claims filed in the Protected Area and Zones A, B, C, D, E, and F is greater than the respective number of relocated properties, since some properties have more than one claim (typically owner + lessee). 3. The number of properties identified considers information obtained in the field, in addition to details of the relocation and compensation claims. These figures may change as analyses progress and the documentation is submitted.
November 2025 - Traders
| Relocation | Compensation | ||||
|---|---|---|---|---|---|
| Eviction map areas | Properties | Properties relocated or under move | Orders that started the compensation flow | Submitted Proposals | Compensations Paid |
| Protection | 129 | 129 (100%) | 185 | 185 (100%) | 185 |
| Zone A | 310 | 310 (100%) | 345 | 345 (100%) | 345 |
| Zone B | 8 | 8 (100%) | 9 | 9 (100%) | 9 |
| Zone C | 50 | 50 (100%) | 64 | 64 (100%) | 64 |
| Zone D | 661 | 661 (100%) | 875 | 875 (100%) | 864 |
| Zone E | 782 | 782 (100%) | 1,042 | 1,042 (100%) | 1,035 |
| Zone F | 25 | 25 (100%) | 36 | 36 (100%) | 35 |
| Zone G | 1,007 | 1,007 (100%) | 1,378 | 1,378 (100%) | 1,372 |
| Zone H | 504 | 504 (100%) | 723 | 723 (100%) | 719 |
| Area 01 | 1,038 | 1,035 (99%) | 1,514 | 1,512 (99%) | 1,503 |
| Overall Total | 4,514 | 4,511 (99%) | 6,171 | 6,169 (99%) | 6,131 |
1. Total stamps classified as an entrepreneur over the meeting to enter the compensation flow. 2. The number of claims filed in the Protected Area and Zones A, B, C, D, E, and F is greater than the respective number of relocated properties, since some properties have more than one claim (typically owner + lessee). 3. The number of properties identified considers information obtained in the field, in addition to details of the relocation and compensation claims. These figures may change as analyses progress and the documentation is submitted.
December 2025 - Traders
| Relocation | Compensation | ||||
|---|---|---|---|---|---|
| Eviction map areas | Properties | Properties relocated or under move | Orders that started the compensation flow | Submitted Proposals | Compensations Paid |
| Protection | 129 | 129 (100%) | 185 | 185 (100%) | 185 |
| Zone A | 310 | 310 (100%) | 345 | 345 (100%) | 345 |
| Zone B | 8 | 8 (100%) | 9 | 9 (100%) | 9 |
| Zone C | 50 | 50 (100%) | 64 | 64 (100%) | 64 |
| Zone D | 661 | 661 (100%) | 875 | 875 (100%) | 864 |
| Zone E | 782 | 782 (100%) | 1,042 | 1,042 (100%) | 1,036 |
| Zone F | 25 | 25 (100%) | 36 | 36 (100%) | 35 |
| Zone G | 1,007 | 1,007 (100%) | 1,378 | 1,378 (100%) | 1,373 |
| Zone H | 504 | 504 (100%) | 723 | 723 (100%) | 719 |
| Area 01 | 1,038 | 1,036 (99%) | 1,514 | 1,512 (99%) | 1,504 |
| Overall Total | 4,514 | 4,512 (99%) | 6,171 | 6,169 (99%) | 6,134 |
1. Total stamps classified as an entrepreneur over the meeting to enter the compensation flow. 2. The number of claims filed in the Protected Area and Zones A, B, C, D, E, and F is greater than the respective number of relocated properties, since some properties have more than one claim (typically owner + lessee). 3. The number of properties identified considers information obtained in the field, in addition to details of the relocation and compensation claims. These figures may change as analyses progress and the documentation is submitted.
January 2026 - Traders
| Relocation | Compensation | ||||
|---|---|---|---|---|---|
| Eviction map areas | Properties | Properties relocated or under move | Orders that started the compensation flow | Submitted Proposals | Compensations Paid |
| Protection | 129 | 129 (100%) | 185 | 185 (100%) | 185 |
| Zone A | 310 | 310 (100%) | 345 | 345 (100%) | 345 |
| Zone B | 8 | 8 (100%) | 9 | 9 (100%) | 9 |
| Zone C | 50 | 50 (100%) | 64 | 64 (100%) | 64 |
| Zone D | 661 | 661 (100%) | 875 | 875 (100%) | 864 |
| Zone E | 782 | 782 (100%) | 1,042 | 1,042 (100%) | 1,036 |
| Zone F | 25 | 25 (100%) | 36 | 36 (100%) | 35 |
| Zone G | 1,007 | 1,007 (100%) | 1,378 | 1,378 (100%) | 1,373 |
| Zone H | 504 | 504 (100%) | 723 | 723 (100%) | 719 |
| Area 01 | 1,038 | 1,036 (99%) | 1,513 | 1,513 (100%) | 1,504 |
| Overall Total | 4,514 | 4,512 (99%) | 6,170 | 6,170 (100%) | 6,134 |
1. Total stamps classified as an entrepreneur over the meeting to enter the compensation flow. 2. The number of claims filed in the Protected Area and Zones A, B, C, D, E, and F is greater than the respective number of relocated properties, since some properties have more than one claim (typically owner + lessee). 3. The number of properties identified considers information obtained in the field, in addition to details of the relocation and compensation claims. These figures may change as analyses progress and the documentation is submitted.
FEBRUARY 2026 - Traders
| Relocation | Compensation | ||||
|---|---|---|---|---|---|
| Eviction map areas | Properties | Properties relocated or under move | Orders that started the compensation flow | Submitted Proposals | Compensations Paid |
| Protection | 129 | 129 (100%) | 185 | 185 (100%) | 185 |
| Zone A | 310 | 310 (100%) | 345 | 345 (100%) | 345 |
| Zone B | 8 | 8 (100%) | 9 | 9 (100%) | 9 |
| Zone C | 50 | 50 (100%) | 64 | 64 (100%) | 64 |
| Zone D | 661 | 661 (100%) | 875 | 875 (100%) | 864 |
| Zone E | 782 | 782 (100%) | 1,042 | 1,042 (100%) | 1,036 |
| Zone F | 25 | 25 (100%) | 36 | 36 (100%) | 35 |
| Zone G | 1,007 | 1,007 (100%) | 1,378 | 1,378 (100%) | 1,373 |
| Zone H | 504 | 504 (100%) | 723 | 723 (100%) | 719 |
| Area 01 | 1,038 | 1,036 (99%) | 1,513 | 1,513 (100%) | 1,506 |
| Overall Total | 4,514 | 4,512 (99%) | 6,170 | 6,170 (100%) | 6,136 |
1. Total stamps classified as an entrepreneur over the meeting to enter the compensation flow. 2. The number of claims filed in the Protected Area and Zones A, B, C, D, E, and F is greater than the respective number of relocated properties, since some properties have more than one claim (typically owner + lessee). 3. The number of properties identified considers information obtained in the field, in addition to details of the relocation and compensation claims. These figures may change as analyses progress and the documentation is submitted.
MARCH 2026 - Traders
| Relocation | Compensation | ||||
|---|---|---|---|---|---|
| Eviction map areas | Properties | Properties relocated or under move | Orders that started the compensation flow | Submitted Proposals | Compensations Paid |
| Protection | 129 | 129 (100%) | 185 | 185 (100%) | 185 |
| Zone A | 310 | 310 (100%) | 345 | 345 (100%) | 345 |
| Zone B | 8 | 8 (100%) | 9 | 9 (100%) | 9 |
| Zone C | 50 | 50 (100%) | 64 | 64 (100%) | 64 |
| Zone D | 661 | 661 (100%) | 875 | 875 (100%) | 864 |
| Zone E | 782 | 782 (100%) | 1,042 | 1,042 (100%) | 1,036 |
| Zone F | 25 | 25 (100%) | 36 | 36 (100%) | 35 |
| Zone G | 1,007 | 1,007 (100%) | 1,378 | 1,378 (100%) | 1,373 |
| Zone H | 504 | 504 (100%) | 723 | 723 (100%) | 719 |
| Area 01 | 1,038 | 1,037 (99%) | 1,513 | 1,513 (100%) | 1,506 |
| Overall Total | 4,514 | 4,513 (99%) | 6,170 | 6,170 (100%) | 6,136 |
1. Total stamps classified as an entrepreneur over the meeting to enter the compensation flow. 2. The number of claims filed in the Protected Area and Zones A, B, C, D, E, and F is greater than the respective number of relocated properties, since some properties have more than one claim (typically owner + lessee). 3. The number of properties identified considers information obtained in the field, in addition to details of the relocation and compensation claims. These figures may change as analyses progress and the documentation is submitted.
APRIL 2026 - Traders
| Relocation | Compensation | ||||
|---|---|---|---|---|---|
| Eviction map areas | Properties | Properties relocated or under move | Orders that started the compensation flow | Submitted Proposals | Compensations Paid |
| Protection | 129 | 129 (100%) | 185 | 185 (100%) | 185 |
| Zone A | 310 | 310 (100%) | 345 | 345 (100%) | 345 |
| Zone B | 8 | 8 (100%) | 9 | 9 (100%) | 9 |
| Zone C | 50 | 50 (100%) | 64 | 64 (100%) | 64 |
| Zone D | 661 | 661 (100%) | 875 | 875 (100%) | 864 |
| Zone E | 782 | 782 (100%) | 1,042 | 1,042 (100%) | 1,036 |
| Zone F | 25 | 25 (100%) | 36 | 36 (100%) | 35 |
| Zone G | 1,007 | 1,007 (100%) | 1,378 | 1,378 (100%) | 1,373 |
| Zone H | 504 | 504 (100%) | 723 | 723 (100%) | 719 |
| Area 01 | 1,038 | 1,037 (99%) | 1,513 | 1,513 (100%) | 1,506 |
| Overall Total | 4,514 | 4,513 (99%) | 6,170 | 6,170 (100%) | 6,136 |
1. Total stamps classified as an entrepreneur over the meeting to enter the compensation flow. 2. The number of claims filed in the Protected Area and Zones A, B, C, D, E, and F is greater than the respective number of relocated properties, since some properties have more than one claim (typically owner + lessee). 3. The number of properties identified considers information obtained in the field, in addition to details of the relocation and compensation claims. These figures may change as analyses progress and the documentation is submitted.
MAY 2026 - Traders
| Relocation | Compensation | ||||
|---|---|---|---|---|---|
| Eviction map areas | Properties | Properties relocated or under move | Orders that started the compensation flow | Submitted Proposals | Compensations Paid |
| Protection | 129 | 129 (100%) | 185 | 185 (100%) | 185 |
| Zone A | 310 | 310 (100%) | 345 | 345 (100%) | 345 |
| Zone B | 8 | 8 (100%) | 9 | 9 (100%) | 9 |
| Zone C | 50 | 50 (100%) | 64 | 64 (100%) | 64 |
| Zone D | 661 | 661 (100%) | 875 | 875 (100%) | 864 |
| Zone E | 782 | 782 (100%) | 1,043 | 1,043 (100%) | 1,036 |
| Zone F | 25 | 25 (100%) | 36 | 36 (100%) | 35 |
| Zone G | 1,007 | 1,007 (100%) | 1,378 | 1,378 (100%) | 1,373 |
| Zone H | 504 | 504 (100%) | 723 | 723 (100%) | 719 |
| Area 01 | 1,038 | 1,037 (99%) | 1,513 | 1,513 (100%) | 1,506 |
| Overall Total | 4,514 | 4,513 (99%) | 6,171 | 6,171 (100%) | 6,136 |
1. Total stamps classified as an entrepreneur over the meeting to enter the compensation flow. 2. The number of claims filed in the Protected Area and Zones A, B, C, D, E, and F is greater than the respective number of relocated properties, since some properties have more than one claim (typically owner + lessee). 3. The number of properties identified considers information obtained in the field, in addition to details of the relocation and compensation claims. These figures may change as analyses progress and the documentation is submitted.
For any questions and concerns, please call
0800 006 3029
Monday through Friday, 9:00 a.m. to 6:00 p.m. (except for holidays).
Free calls, including from mobile phones.